


Description
“Unequal Weather: New York City” is an A.I. driven data visualization that examines environmental inequity across New York City neighborhoods in real time. By pairing live meteorological feeds with local socioeconomic metrics, the installation utilizes machine learning models to continuously analyze and visualize the stark correlation between urban heat islands and systemic economic disparity. Data reveals that lower-income neighborhoods-such as Mott Haven, Hunt’s Point, and Brownsville-consistently experience significantly higher surface temperatures during extreme heat events compared to wealthier areas like the Upper East Side. This thermal variance is a direct result of decades of uneven environmental investment, manifesting as a lack of urban tree canopy, fewer public green spaces, and a high density of heat-retaining asphalt, industrial infrastructure, and concrete surfaces in vulnerable communities. By deploying Al to process, interpret, and cross-reference these complex, disparate environmental datasets, “Unequal Weather” serves as a critical mirror-demonstrating how climate change does not impact us equally, but instead amplifies existing socioeconomic divides across the five
Link: https://unequalweather.coin-operated.com/nyc/
Examples of NYC Neighborhood Data Sets
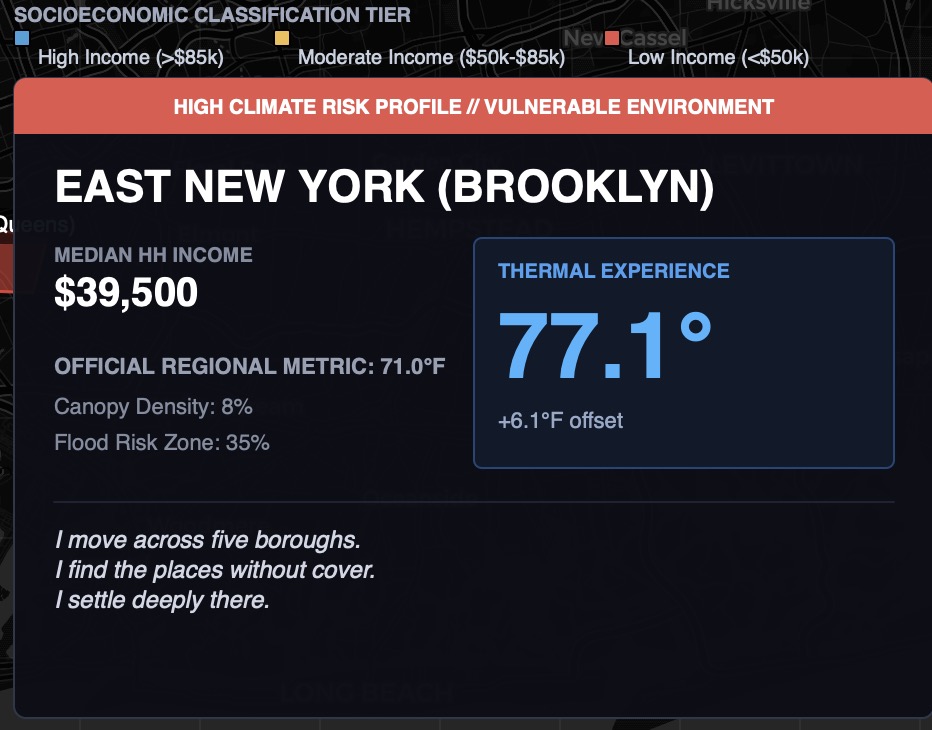
Screenshot
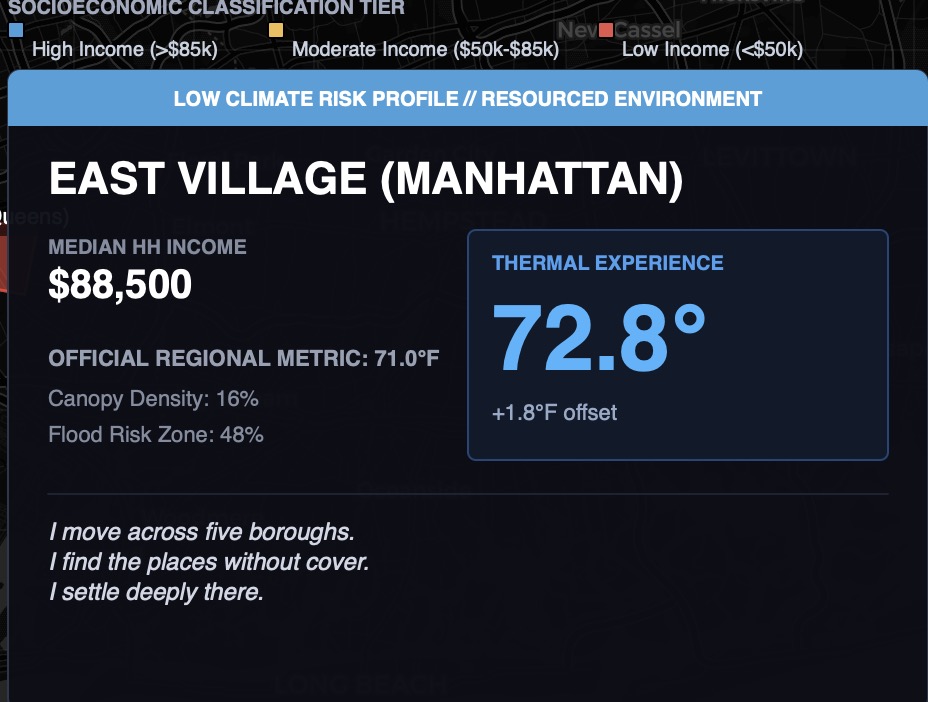
Screenshot
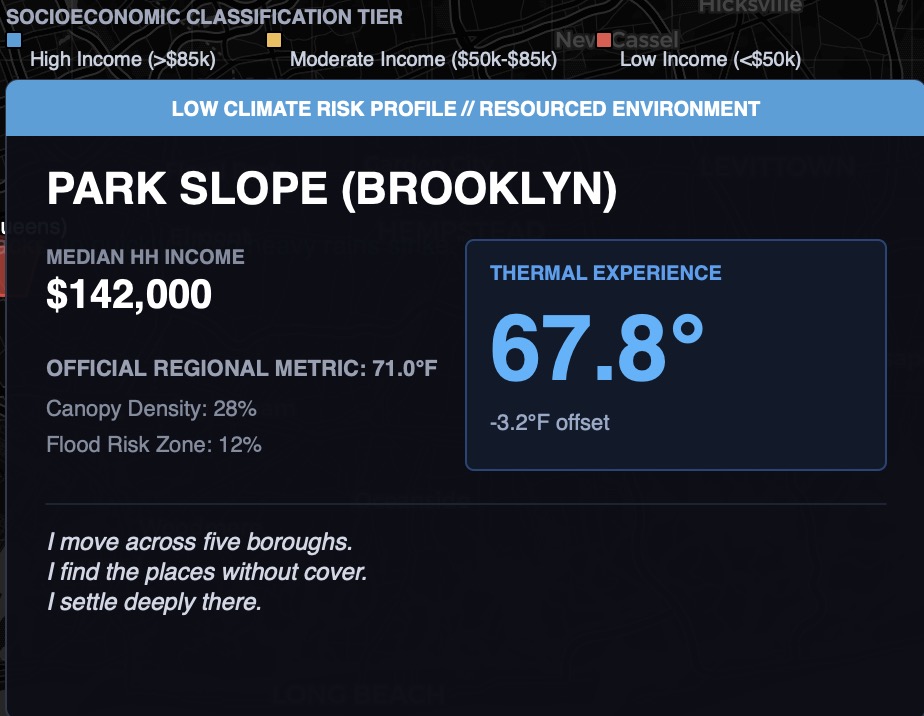
Screenshot
